Chart sample conditions, pinpoint trends and compare unit and component performance.
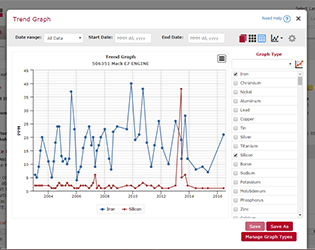
- Track oil analysis trends in abnormal test results for individual pieces of equipment using multiple test parameters
- Overlay test results by make or model to compare equipment performance between individual units or across populations of units
- Chart sample condition for specific components to view performance compared to similar models or families of component types
Technical Support
- Help icons on each menu tab explain the tab’s functionality
- Quick Links give users access to detailed training videos, quick start guides and frequently asked questions
- The LOAMS Help Desk is available to demonstrate LOAMS features or answer at 1.800.655.4473 or loams@analystsinc.com.
More LOAMS Features & Functionality
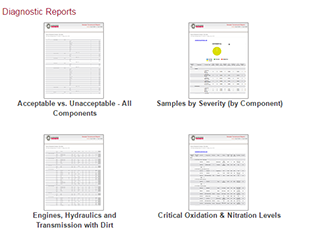 |
Diagnostic ReportsQuickly identify equipment-specific issues. |
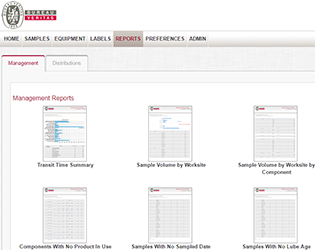 |
Management ReportsCompile a comprehensive view of all oil analysis program data generated. |
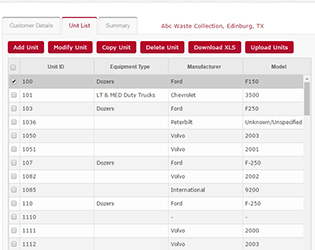 |
Equipment & Sample Report ManagementMaintain clean equipment lists, submit samples and print jar labels online and create custom search filters. |
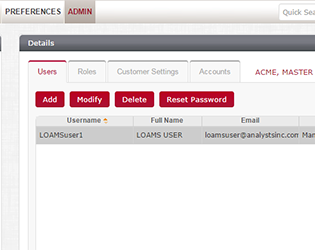 |
System Configuration & AdministrationUser roles are defined by permissions which determine what individual users can and cannot do in LOAMS. |
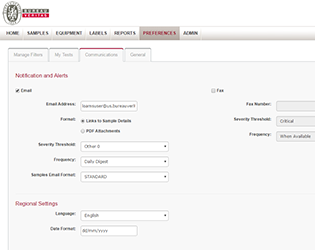 |
Communications & DistributionsUser preferences determine how and when information is received, how it’s displayed and how you can communicate it with others. |